Setting Up a Dalvik Debugger With IDA Pro
In this post, I will go through my adventures of debugging Dalvik code IDA Pro and setting up an emulator without installing Android Studio. All of this was done on a Debian system.
Setting up the emulator
Java
My main goal was to set up an Android emulator without installing Android studio. But first, make sure Java is installed on your system. In my case I installed OpenJDK 24:
1 | sudo apt install openjdk-24-jdk |
For Android tools to work properly, you need to set the JAVA_HOME environment variable. To find out where Java is installed,
you can run:
1 | java -XshowSettings:properties -version |
Look for a line containing java.home, which in my case was java.home = /usr/lib/jvm/java-24-openjdk-amd64. Therefore, I added the following line to my .bashrc:
1 | export JAVA_HOME="/usr/lib/jvm/java-24-openjdk-amd64" |
Android tools
sdkmanager
Install the Android Command-line tools first. In your installation directory there
should be a cmdline-tools folder, probably containing a subfolder named based on the version of the tools you downloaded.
Android tools will look for a folder named latest, located inside cmdline-tools. So, you can either rename the subfolder to latest, or create a symlink to it:
1 | ln -s cmdline-tools/<version> cmdline-tools/latest |
It’s recommended that you set the ANDROID_HOME environment variable to point to the directory where you installed the command-line tools.
In my case, I installed them in $HOME/programs/android, so I added the following line to my .bashrc:
1 | export ANDROID_HOME="$PATH:$HOME/programs/android" |
Then, add the cmdline-tools/latest/bin directory to your PATH:
1 | export PATH="$PATH:$ANDROID_HOME/cmdline-tools/latest/bin" |
platform-tools
You might want to use tools like adb (Android Debug Bridge) in order to interact with the emulator. Now that you have
the sdkmanager command available, you can install other packages easily.
1 | sdkmanager "platform-tools" |
You probably also want to add these to your PATH:
1 | export PATH="$PATH:$ANDROID_HOME/platform-tools" |
emulator
The actual emulator and the system images can be installed with sdkmanager as well.
1 | sdkmanager "emulator" |
In the above command, android-35 refers to API level 35. google_apis refers to the Google APIs that are included in the system image.
An alternative would be to use default, which is a minimal system image that comes without them, but I highly recommend using the Google APIs version. The
reason is that this image comes with ARM translation libraries, which allow you to run ARM code on the x86 emulator. And of course,
x86_64 refers to the CPU architecture of the emulator system image, which should correspond to the architecture of your host machine. On
Apple Silicon, you should use arm64-v8a instead.
You probably want to add the emulator directory to your PATH as well, along with setting the ANDROID_AVD_HOME environment variable,
which is where the Android Virtual Devices (AVDs) will be stored:
1 | export PATH="$PATH:$ANDROID_HOME/emulator" |
In case you change your mind and want to remove a system image, you can do so with:
1 | sdkmanager --uninstall "system-images;android-35;google_apis;x86_64" |
You can list all available system images with bash sdkmanager --list.
Running the emulator
First, you need to create an Android Virtual Device (AVD) that uses the system image you just installed. You can do this with the avdmanager command:
1 | avdmanager create avd -n android35 -k "system-images;android-35;google_apis;x86_64" |
I have named the emulator “android35”, but feel free to choose a different name. The -k option specifies the system image
to use for the AVD, which should match the one you installed earlier. In case you change your mind and want to remove the AVD, you can do so with:
1 | avdmanager delete avd -n android35 |
And finally, you can start the emulator with:
1 | emulator -avd android35 |
Because the emulator is a graphical application, I have experienced issues when running it on my Debian machine. If you get a crash, it’s probably because the emulator tried to use the graphics driver and failed. There are a few wayt to work around this.
- Use
-gpu off. This disables all GPU acceleration. The emulator uses the most basic, pure software renderer. Some graphics features may be missing or slow and it may cause rendering glitches in some apps, but works on nearly all systems. - Pass the
-gpu swiftshader_indirectoption when starting the emulator. This enables SwiftShader, a software-based 3D renderer developed by Google. All graphics are emulated in software, but with much better compatibility and performance than the “off” fallback. It emulates OpenGL ES via CPU, so most graphical Android apps will display and function almost like on a real device (just slower than with real GPU).
I personally use the second option, so I start the emulator like this:
1 | emulator -avd android35 -gpu swiftshader_indirect -wipe-data |
The -wipe-data option is useful if you want to start with a clean slate, as it removes any existing data from the AVD,
such as installed apps or settings.
Getting the app ready
Make sure the app is debuggable
In order to be debuggable, and Android app must be built with the debuggable flag set to true in the AndroidManifest.xml file.
This means you can’t just take any APK and debug it like that. If you’re looking to play around, you need to get your hands
on a debuggable APK
(or build one yourself). Alternatively, you can try to force the APK to be debuggable by modifying the AndroidManifest.xml
file, but this is not guaranteed to work and may lead to unexpected behavior. If one is so inclined, here’s a quick tutorial:
- Get the latest version of apktool.
- Unpack the file (assuming your APK is named
com.mypackage.apk):1
apktool d -o output-dir com.mypackage.apk
- Open the
AndroidManifest.xmlfile in the output directory and find the<application>XML tag. This tag should contain an attribute namedandroid:debuggable. If it doesn’t exist, add it like this:1
<application android:debuggable="true" ...>
- Repack the APK.
1
apktool b -o com.mypackage.apk output-dir
- Resign the APK.
1
2
3keytool -genkey -v -keystore resign.keystore -alias alias_name -keyalg RSA -keysize 2048 -validity 10000
apksigner sign --ks resign.keystore --ks-key-alias alias_name --out signed.apk com.mypackage.apk
apksigner verify signed.apk - Now you’ve got your debuggable version of the APK as
signed.apk.
Install the app on the emulator
Assuming you APK file is named signed.apk, you can install the APK on the emulator using adb:
1 | adb install signed.apk |
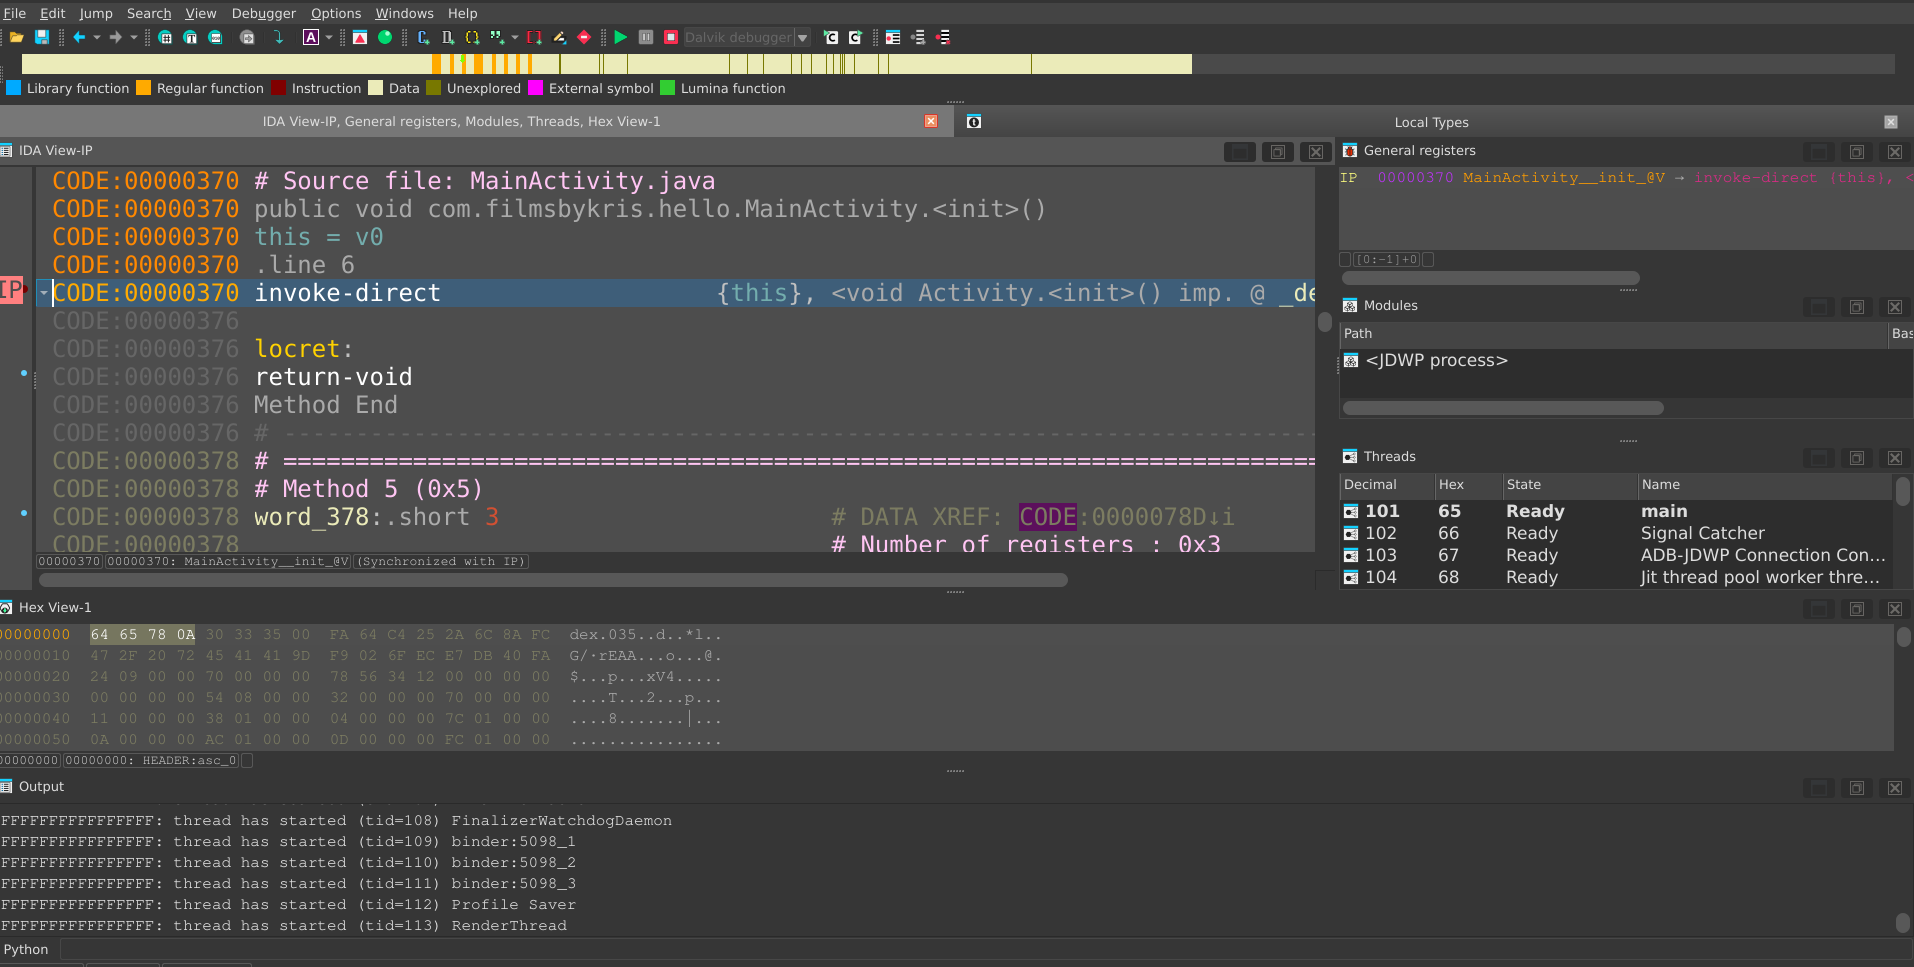
Debugging with IDA Pro
- Make sure you have installed the APK (using
adb install). - Open the APK in IDA Pro and select APK Android Package as the file type.
- Go to
Debugger->Debugger options...->Set specific options. Make sure the path to theADBexecutable is set correctly. Under “Start Application” click “Fill from AndroidManifest.xml” and point it to you APK. This will automatically fetch the package name and application activity name to start with. - Start the process or attach to an already running one.