Perf
Perf is a powerful for profiling and tracing Linux applications. It comes with low overhead and directly uses kernel hooks and performance counters to gather data. It’s part of my toolkit for performance analysis, so I’m going to talk a bit about how I use it.
Installation
Bear in mind that I am on a Debian Sid and you might need to adapt the installation steps for your distribution.
1 | sudo apt update |
You can modify perf setting in /etc/sysctl.d/99-perf.conf (create it if it doesn’t exist). For example, mine looks
like this:
1 | # 0 = allow user-level + system-wide profiling |
The reason to prefix the file with 99- is to make sure it is loaded last, so it overrides any other settings that
might be set by others.
You can check whether perf works by simply checking it over the ls command:
1 | perf stat ls |
Normally you should be able to record profiling information as your own user, but if you get a permission error, you can try running it as root, or execute the following:
1 | sudo chmod 755 /sys/kernel/debug/tracing |
This won’t last across reboots.
Sample Program
Let’s take a real-world example: bzip2.
It’s pretty easy to build, however note that I’m not following the official instructions here. The purpose of this is
rather demonstrating some key points in the profiling process.
Adding debug symbols always helps with the analysis, so I add -g. Whenever I profile my code, I always build it to be
as close as it can get to the production version, and one of the most common flags used is -O2. Unless you have a very
specific reason for it, please don’t waste your time profiling unoptimized code. You don’t want to work on a problem
that doesn’t exist in production.
1 | git clone --branch bzip2-1.0.8 --single-branch https://gitlab.com/bzip2/bzip2.git |
Profiling
Let’s create a 500MB blob of random data and compress it with bzip2:
1 | dd if=/dev/urandom of=big.bin bs=1M count=500 |
Profiling is as simple as running the following command:
1 | perf record --max-size 10G --call-graph dwarf -- ./bzip2 -k big.bin |
record- Launches the “record” subcommand, which runs the program and collects performance data.--max-size 10G- Sets the maximum size of the perf.data file to 10GB. It will stop collecting further samples rather than grow out of bound.--call-graph dwarf- Capture full stack traces (call graphs) for each sample using DWARF-based unwinding. This gives you precise function-call trees in the later perf report or flame-graph, at the cost of a bit more overhead and larger output.--- Indicates the end ofperfoptions and the beginning of the command to be profiled../bzip2 -k big.bin- Runs thebzip2program with inputbig.bin. The-kargument keeps the originalbig.binso you can rerun without re-dd’ing.
If you want to profile the program only after a specific point, you can use the -p option to attach to a running process:
1 | perf record --max-size 10G --call-graph dwarf -p <PID> |
Finally, you can view the results with:
1 | perf report |
Hotspot
Installation
If you’re looking for something prettier, you can use hotspot.
It’s a GUI for perf that allows you to visualize the data in a more user-friendly way. I personally prefer it over the
default perf report, but it’s a matter of taste. Installing it should be as easy as:
1 | sudo apt update |
Unfortunately, I experienced some problems lately because of missing dependencies (April 2025). Turns out that one of its
dependencies is policykit-1, which is no longer available. However, this is just a meta package to install pkexec and
polkitd, which are the actual programs that do the work. Knowing, we can trick the package manager into thinking we have
installed policykit-1 by creating a dummy package, while we actually install the “real” dependencies. This is a bit of a
hack, but it works.
1 | sudo apt update |
Edit the policykit-1 template, uncommenting “Version” and “Depends”.
1 | Package: policykit-1 |
Then build and install the package:
1 | equivs-build policykit-1 |
Then you should be able to install hotspot as if nothing happened:
1 | sudo apt install hotspot |
Data Visualization
Once you have hotspot installed, you can run it in the same directory where you have the perf.data file.
1 | hotspot |
You may start from the summary view, which shows you the most expensive functions in your program.
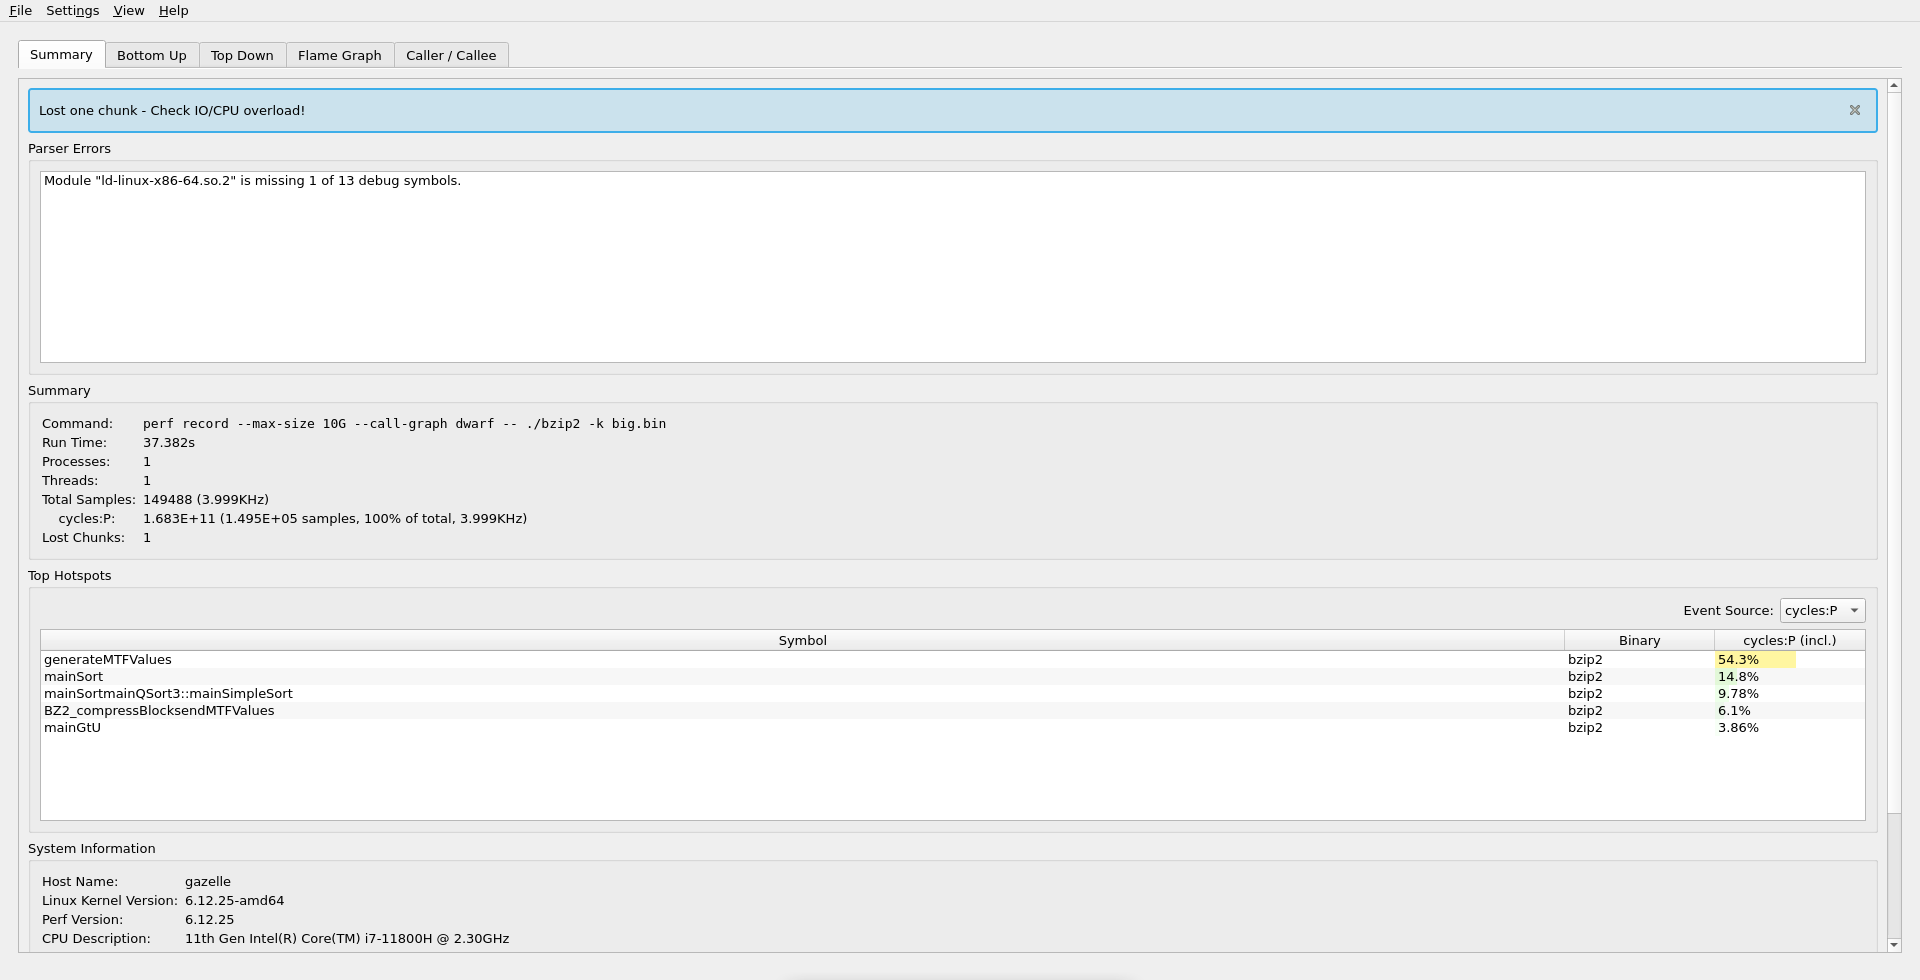
Here we can see the most expensive function is generateMTFValues, where the program spends about half of the time.
One of my favourite features of hotspot is the Flame Graph, which shows the call graph in a clear and concise way. You
can explore it interactively in the application, or export it as an SVG file (View -> Export -> Flame Graph).

- BZ2_blockSort - 27.9% cost
- BZ2_compressBlocksendMTFValues - 9.09% cost
- generateMTFValues - 54.3% cost
If I were to optimize this code, I would start with generateMTFValues, since it has the highest cost.
Other tools
Generally, perf is all I need, but it only works on Linux. Here are a few alternatives that are available on other
platforms.
-
I used it in the past, and it’s a great alternative to
perfon Windows. The disadvantage is that it requires an Intel CPU (sorry AMD users). I especially like the GUI, which I find easy to navigate. However, it’s bulkier thanperf, and I don’t see a clear advantage over it on Linux. I would recommend to look into it if you are on Windows and have an Intel CPU. -
This is a built-in profiler in Clion, which has the advantage of being integrated into the IDE. On Linux it uses
perfunder the hood, so I usually prefer to useperfdirectly. On MacOS it uses DTrace, which is not bad. I have only used it a few times, but if you are a Clion user on MacOS and want a glimpse of what is going on in your code, it’s worth checking out. -
Never used it, but it seems like a good alternative on MacOS, especially if you don’t use Clion profiler.